| 2022 R'000 |
2022 % |
2021* R'000 |
2021* % |
2020* R'000 |
2020* % |
2019* R'000 |
2019* % |
||
|---|---|---|---|---|---|---|---|---|---|
| VALUE ADDED | |||||||||
| Value added by operating activities | 2 433 050 | 96.8 | 2 036 799 | 97.2 | 2 029 637 | 95.5 | 2 284 291 | 95.9 | |
| Revenue | 17 806 262 | 18 864 344 | 23 312 162 | 25 869 433 | |||||
| Net operating expenses | (15 373 212) | (16 827 545) | (21 282 525) | (23 585 142) | |||||
| Value added by investing activities | 80 993 | 3.2 | 59 719 | 2.8 | 95 761 | 4.5 | 96 809 | 4.1 | |
| Interest income | 80 993 | 59 719 | 95 761 | 96 809 | |||||
| 2 514 043 | 100 | 2 096 518 | 100 | 2 125 398 | 100 | 2 381 100 | 100 | ||
| VALUE DISTRIBUTED | |||||||||
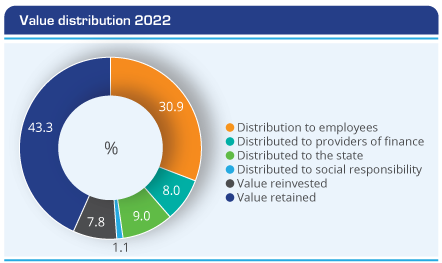
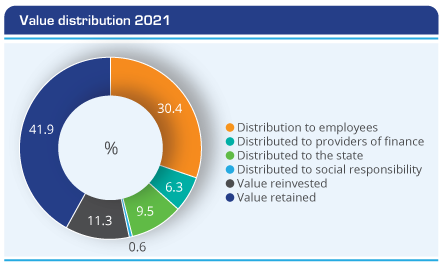
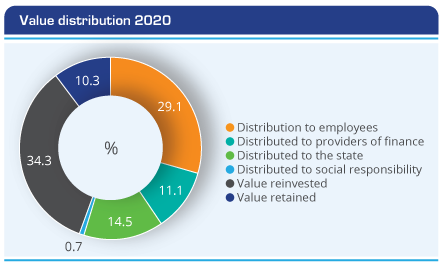
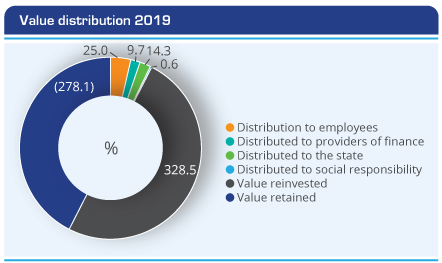
| Distributed to employees | 780 255 | 31.0 | 637 387 | 30.4 | 619 167 | 29.1 | 594 183 | 25.0 | |
| Salaries, wages, medical and other benefits | 780 255 | 637 387 | 619 167 | 594 183 | |||||
| Distributed to providers of finance | 201 225 | 8.0 | 131 949 | 6.3 | 236 186 | 11.1 | 231 132 | 9.7 | |
| Finance costs | 201 225 | 131 949 | 236 186 | 231 132 | |||||
| Distributed to the state | 226 591 | 9.0 | 200 013 | 9.5 | 307 388 | 14.5 | 339 670 | 14.3 | |
| Income tax | 226 591 | 200 013 | 307 388 | 339 670 | |||||
| Distributed to socio-economic responsibility | 17 548 | 0.7 | 12 052 | 0.6 | 14 584 | 0.7 | 15 339 | 0.6 | |
| Socio-economic development | 17 548 | 12 052 | 14 584 | 15 339 | |||||
| Value reinvested | 196 427 | 7.8 | 237 101 | 11.3 | 728 968 | 34.3 | 7 822 972 | 328.5 | |
| Depreciation, amortisation and impairment | 110 798 | 181 113 | 750 754 | 4 134 181 | |||||
| Net discounting finance cost | – | – | – | 11 929 | |||||
| Share of (profits)/losses of associates and joint ventures | (8 042) | (2 951) | (13 640) | 3 701 410 | |||||
| Deferred taxation | 93 671 | 58 939 | (8 146) | (24 548) | |||||
| Value retained | 1 091 997 | 43.5 | 878 016 | 41.9 | 219 105 | 10.3 | (6 622 196) | (278.1) | |
| Retained profit | 1 027 079 | 830 607 | 124 481 | (6 646 383) | |||||
| Minority shareholders' interest | 64 918 | 47 409 | 94 624 | 24 187 | |||||
| 2 514 043 | 100 | 2 096 518 | 100 | 2 125 398 | 100 | 2 381 100 | 100 |
| * | The value added statement has been prepared based on the results of both the continuing and discontinued operations of the Group. Refer to note 11 of the Group annual financial statements for details of discontinued operations. |