

UNLIMITED
POTENTIAL

UNLIMITED
POTENTIAL
|
2026 R’000 |
2026 % |
2025 R’000 |
2025 % |
2024 R’000 |
2024 % |
2023 R’000 |
2023 % |
||||
| VALUE ADDED | |||||||||||
| VALUE ADDED BY OPERATING ACTIVITIES | (3 508 453) | 108.6 | 2 488 582 | 75.6 | 2 191 766 | 70.8 | 2 208 065 | 84.3 | |||
| Revenue | 13 052 808 | 14 050 177 | 14 598 444 | 18 918 263 | |||||||
| Net operating expenses | (16 561 261) | (11 561 595) | (12 406 678) | (16 710 198) | |||||||
| VALUE ADDED BY INVESTING ACTIVITIES | 277 599 | (8.6) | 803 857 | 24.4 | 901 884 | 29.2 | 411 540 | 15.7 | |||
| Interest income | 277 599 | 803 857 | 901 884 | 411 540 | |||||||
| (3 230 854) | 100 | 3 292 439 | 100 | 3 093 650 | 100 | 2 619 605 | 100 | ||||
| VALUE DISTRIBUTED | |||||||||||
| DISTRIBUTED TO EMPLOYEES | 1 266 793 | (39.2) | 1 052 704 | 32.0 | 961 883 | 31.1 | 945 501 | 36.0 | |||
| Salaries, wages, medical and other benefits | 1 266 793 | 1 052 704 | 961 883 | 945 501 | |||||||
| DISTRIBUTED TO PROVIDERS OF FINANCE | 991 319 | (30.7) | 1 090 314 | 33.1 | 1 121 356 | 36.2 | 682 599 | 26.1 | |||
| Finance costs | 991 319 | 1 090 314 | 1 121 356 | 682 599 | |||||||
| DISTRIBUTED TO THE STATE | 76 777 | (2.4) | 337 776 | 10.3 | 136 033 | 4.4 | 257 276 | 9.8 | |||
| Income Tax | 76 777 | 337 776 | 136 033 | 257 276 | |||||||
| DISTRIBUTED TO SOCIAL RESPONSIBILITY | 12 516 | (0.4) | 6 104 | 0.2 | 11 621 | 0.4 | 14 914 | 0.6 | |||
| Socio-economic development | 12 516 | 6 104 | 11 621 | 14 914 | |||||||
| VALUE REINVESTED | (892 599) | 27.6 | (1 675 179) | (50.9) | 203 172 | 6.6 | 431 142 | 16.5 | |||
| Depreciation, amortisation, impairment and fair value movement | 438 237 | 18 458 | 156 666 | 121 164 | |||||||
| Impairment/(reversal of impairment) of investment in associate | 9 273 | (1 555 042) | – | (962 531) | |||||||
| Share of (profits)/losses of associates and joint ventures | (1 215 906) | 55 376 | (15 416) | 1 329 747 | |||||||
| Deferred taxation | (124 203) | (193 971) | 61 922 | (57 238) | |||||||
| VALUE RETAINED | (4 685 660) | 145.0 | 2 480 720 | 75.3 | 659 585 | 21.3 | 288 173 | 11.0 | |||
| Retained profit | (4 882 394) | 2 484 243 | 647 386 | 268 966 | |||||||
| Minority shareholders’ interest | 196 734 | (3 523) | 12 199 | 19 207 | |||||||
| (3 230 854) | 100 | 3 292 439 | 100 | 3 093 650 | 100 | 2 619 605 | 100 |
Value distribution (%)
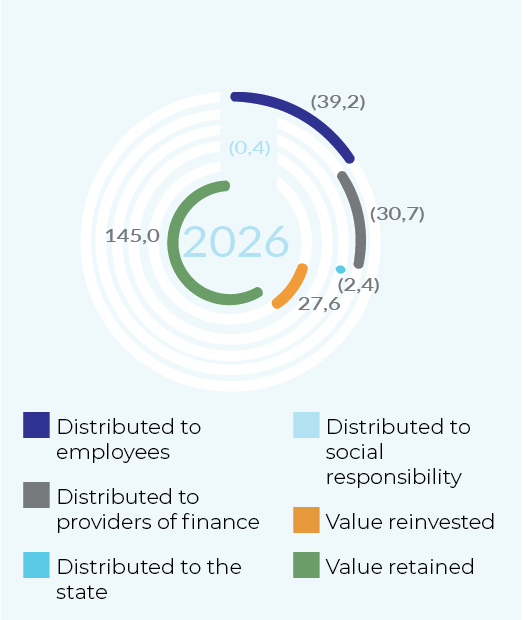
Value distribution (%)

Value distribution (%)
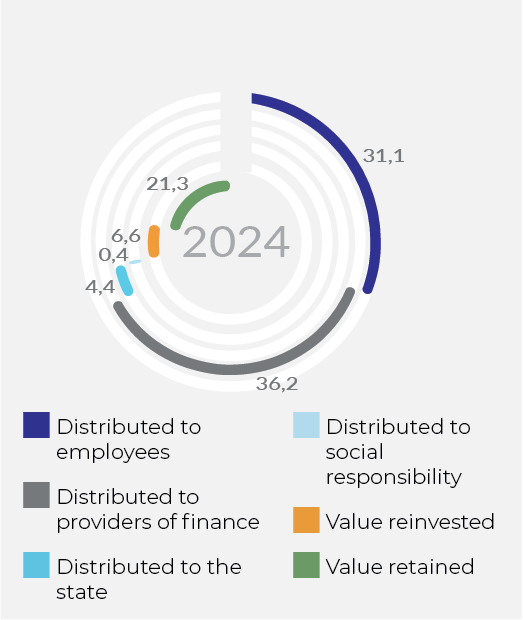
Value distribution (%)
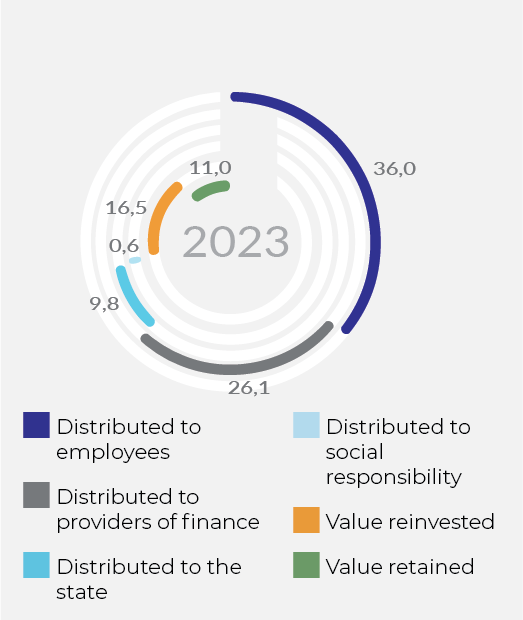


BLU Label Unlimited Integrated Annual Report 2025