




 78 / 248

76
BLUE LABEL INTEGRATED ANNUAL REPORT 2015
VALUE ADDED STATEMENT
VALUE ADDED
Value added by operating activities
1 492 949
98.0
Revenue
22 044 222
Net operating expenses
(20 551 273)
Value added by investing activities
30 721
2.0
Interest income
30 721
1 523 670
100
VALUE DISTRIBUTED
Distributed to employees
407 448
26.7
Salaries, wages, medical and other benefits
407 448
Distributed to providers of finance
67 964
4.5
Finance costs
67 964
Distributed to the state
275 768
18.1
Income tax
275 768
Distributed to social responsibility
5 336
0.4
Corporate social investment
5 336
Value reinvested
185 961
12.2
Depreciation, amortisation and impairment
94 019
Net discounting finance cost
22 875
Share of losses of associates and joint ventures
79 338
Deferred taxation
(10 271)
Value retained
581 193
38.1
Retained profit
577 617
Non-controlling shareholders´ interest
3 576
1 523 670
100
2015
R’000
2015
%
26.7
4.5
38.1
18.1
12.2
0.4
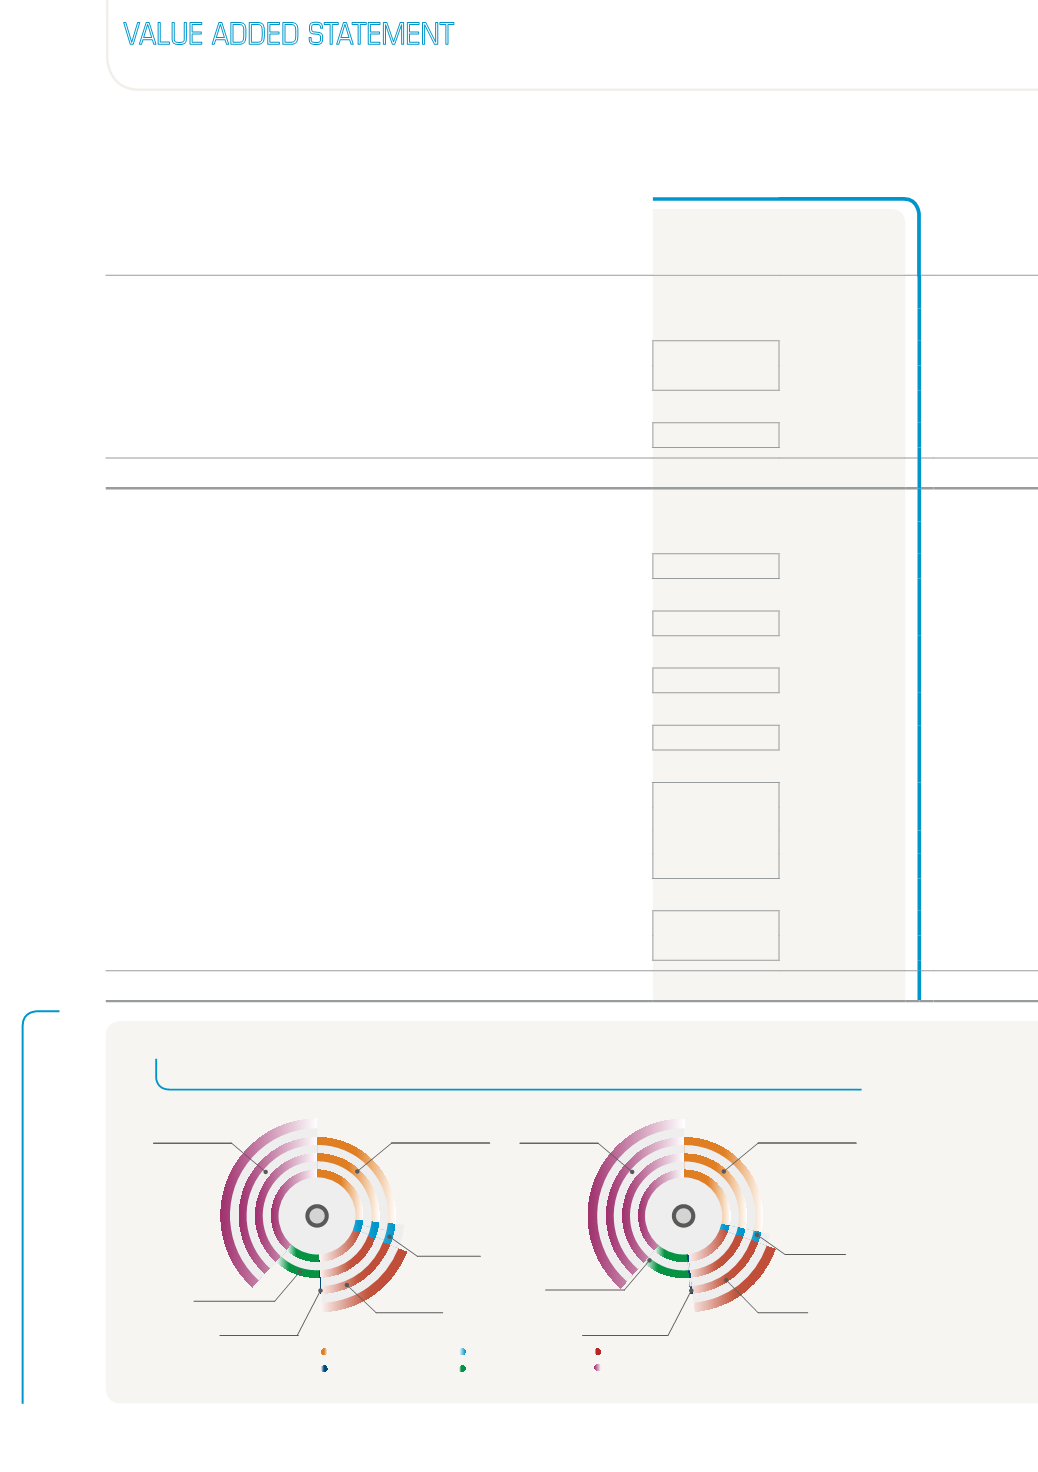
Value distributed 2015
Value distributed 2014
To employees
To social responsibility
Value reinvested
To providers of nance To the state
28.6
2.0
38.6
17.9
12.5
0.4
Value retained