


 81 / 220

BLUE LABEL
INTEGRATED ANNUAL REPORT 2017
79
/
2015
R’000
2015
%
2014
R’000
2014
%
2013
R’000
2013
%
2012
R’000
2012
%
1 492 949
98.0
1 125 610
96.7
1 050 765
95.9
1 068 131
94.7
22 044 222
19 401 666
18 984 210
18 722 080
(20 551 273)
(18 276 056)
(17 933 445)
(17 653 949)
30 721
2.0
38 807
3.3
45 489
4.1
59 730
5.3
30 721
38 807
45 489
59 730
1 523 670
100
1 164 417
100
1 096 254
100
1 127 861
100
407 448
26.8
332 542
28.6
332 901
30.4
329 406
29.2
407 448
332 542
332 901
329 406
67 964
4.5
22 993
2.0
23 767
2.2
3 307
0.3
67 964
22 993
23 767
3 307
275 768
18.1
208 996
17.9
215 075
19.6
190 759
16.9
275 768
208 996
215 075
190 759
5 336
0.4
5 075
0.4
4 242
0.4
3 340
0.3
5 336
5 075
4 242
3 340
185 961
12.2
145 896
12.5
112 164
10.2
181 575
16.1
94 019
65 137
67 951
91 557
22 875
26 440
15 558
66 505
–
–
–
–
79 338
56 873
47 326
19 835
(10 271)
(2 554)
(18 671)
3 678
581 193
38.0
448 915
38.6
408 105
37.2
419 474
37.2
577 617
450 230
424 841
438 104
3 576
(1 315)
(16 736)
(18 630)
1 523 670
100
1 164 417
100
1 096 254
100
1 127 861
100
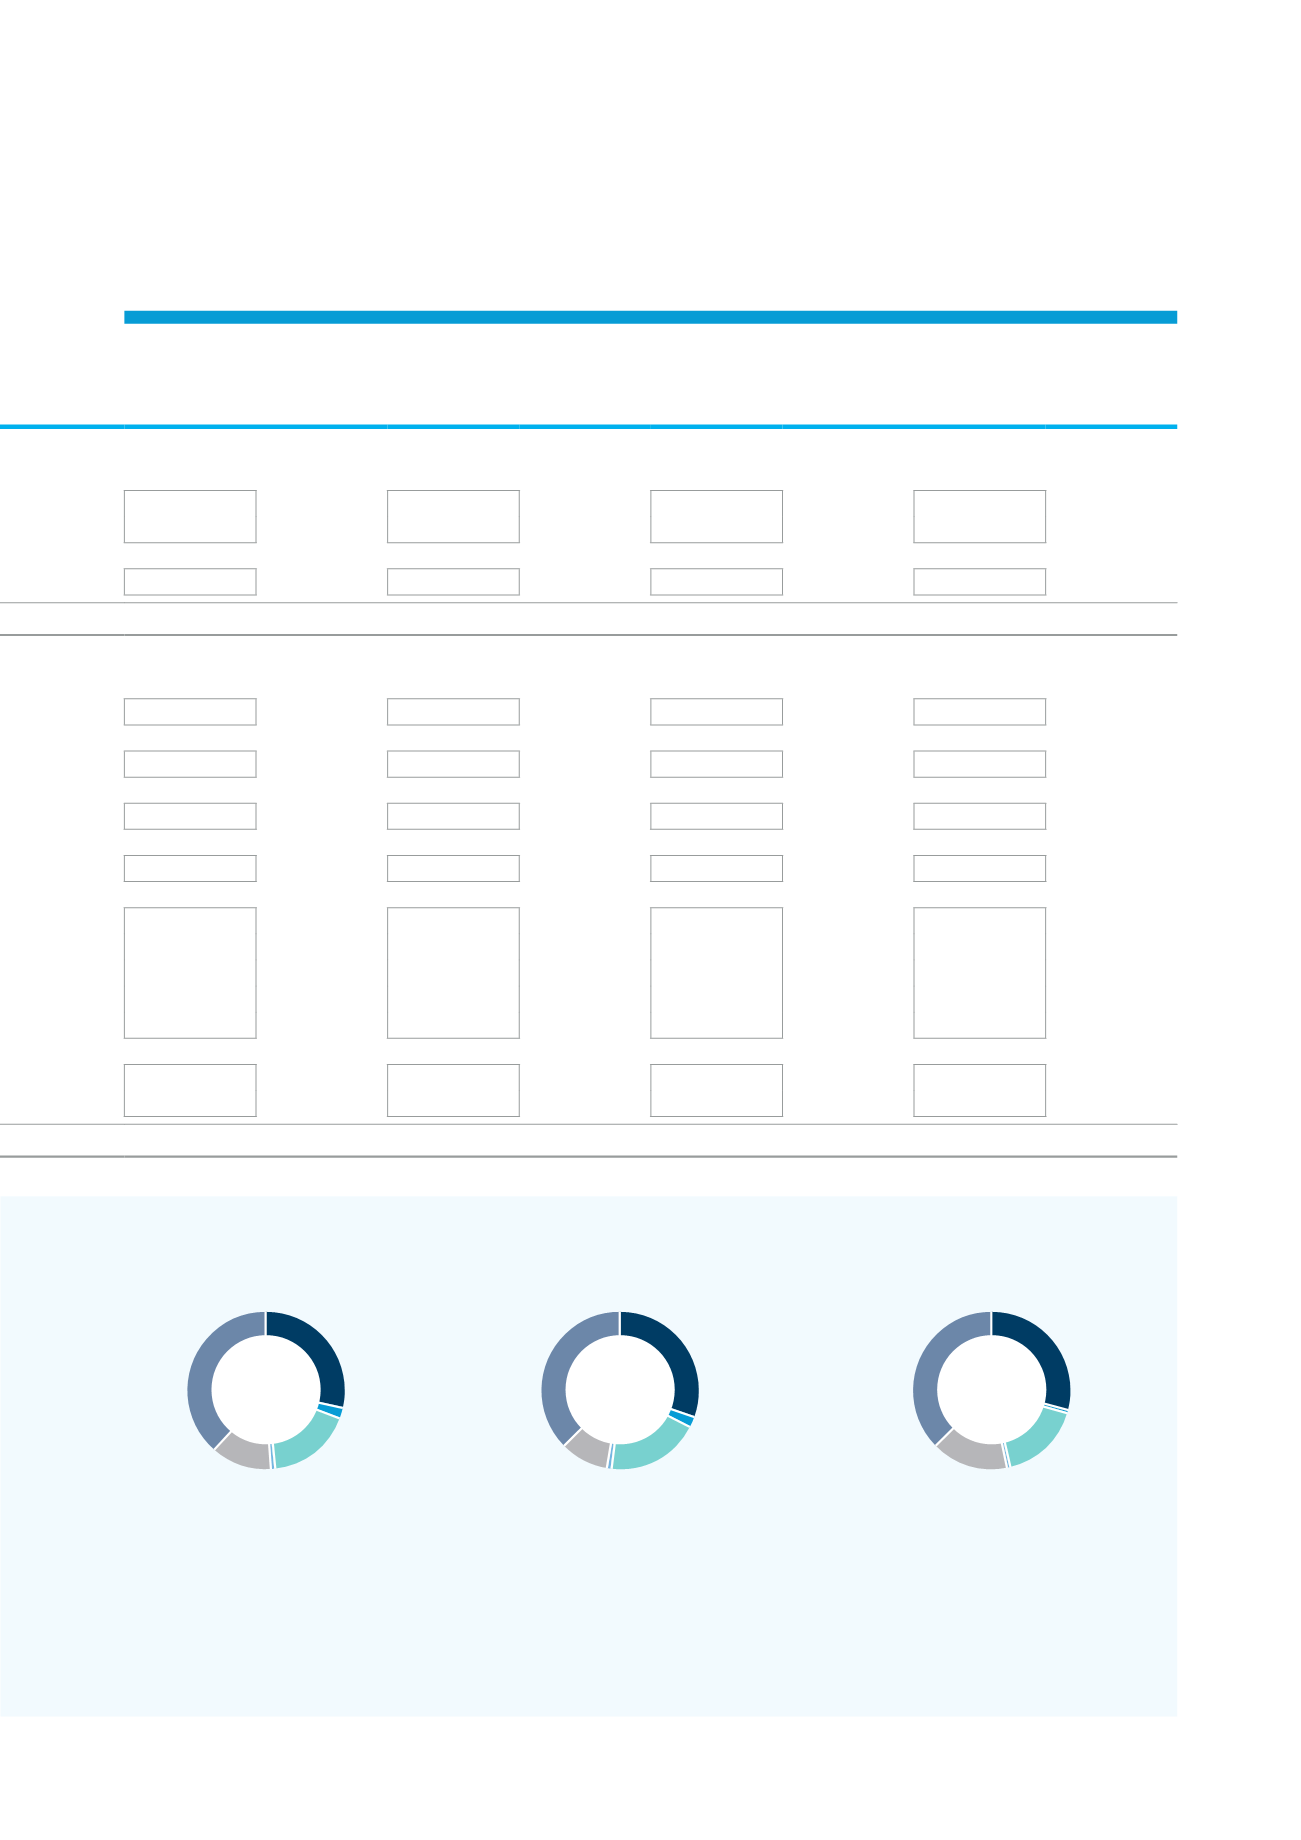
X
Employees
28.6%
X
Providers of finance
2.0%
X
The state
17.9%
X
Social responsiblitiy
0.4%
X
Reinvested
12.5%
X
Value retained
38.6%
Value distributed
2014
X
Employees
30.4%
X
Providers of finance
2.2%
X
The state
19.6%
X
Social responsiblitiy
0.4%
X
Reinvested
10.2%
X
Value retained
37.2%
Value distributed
2013
X
Employees
29.2%
X
Providers of finance
0.3%
X
The state
16.9%
X
Social responsiblitiy
0.3%
X
Reinvested
16.1%
X
Value retained
37.2%
Value distributed
2012