


 80 / 220

BLUE LABEL
INTEGRATED ANNUAL REPORT 2017
/
78
Value added statement
2017
R’000
2017
%
2016
R’000
2016
%
VALUE ADDED
Value added by operating activities
1 792 768
95.8
1 674 203
96.3
Revenue
26 311 875
26 204 722
Net operating expenses
(24 519 107)
(24 530 519)
Value added by investing activities
79 125
4.2
64 266
3.7
Interest income
79 125
64 266
1 871 893
100
1 738 469
100
VALUE DISTRIBUTED
Distributed to employees
452 985
24.2
427 116
24.6
Salaries, wages, medical and other benefits
452 985
427 116
Distributed to providers of finance
105 518
5.6
48 207
2.8
Finance costs
105 518
48 207
Distributed to the state
345 990
18.5
305 420
17.6
Income tax
345 990
305 420
Distributed to social responsibility
8 460
0.5
6 528
0.4
Corporate social investment
8 460
6 528
Value reinvested
138 079
7.4
219 586
12.6
Depreciation, amortisation and impairment
112 851
98 183
Net discounting finance cost
34 440
36 270
Gain on associates and joint venture measured at fair value
(160 200)
–
Share of losses of associates and joint ventures
164 941
71 770
Deferred taxation
(13 953)
13 363
Value retained
820 861
43.8
731 612
42.0
Retained profit
786 965
691 590
Minority shareholders' interest
33 896
40 022
1 871 893
100
1 738 469
100
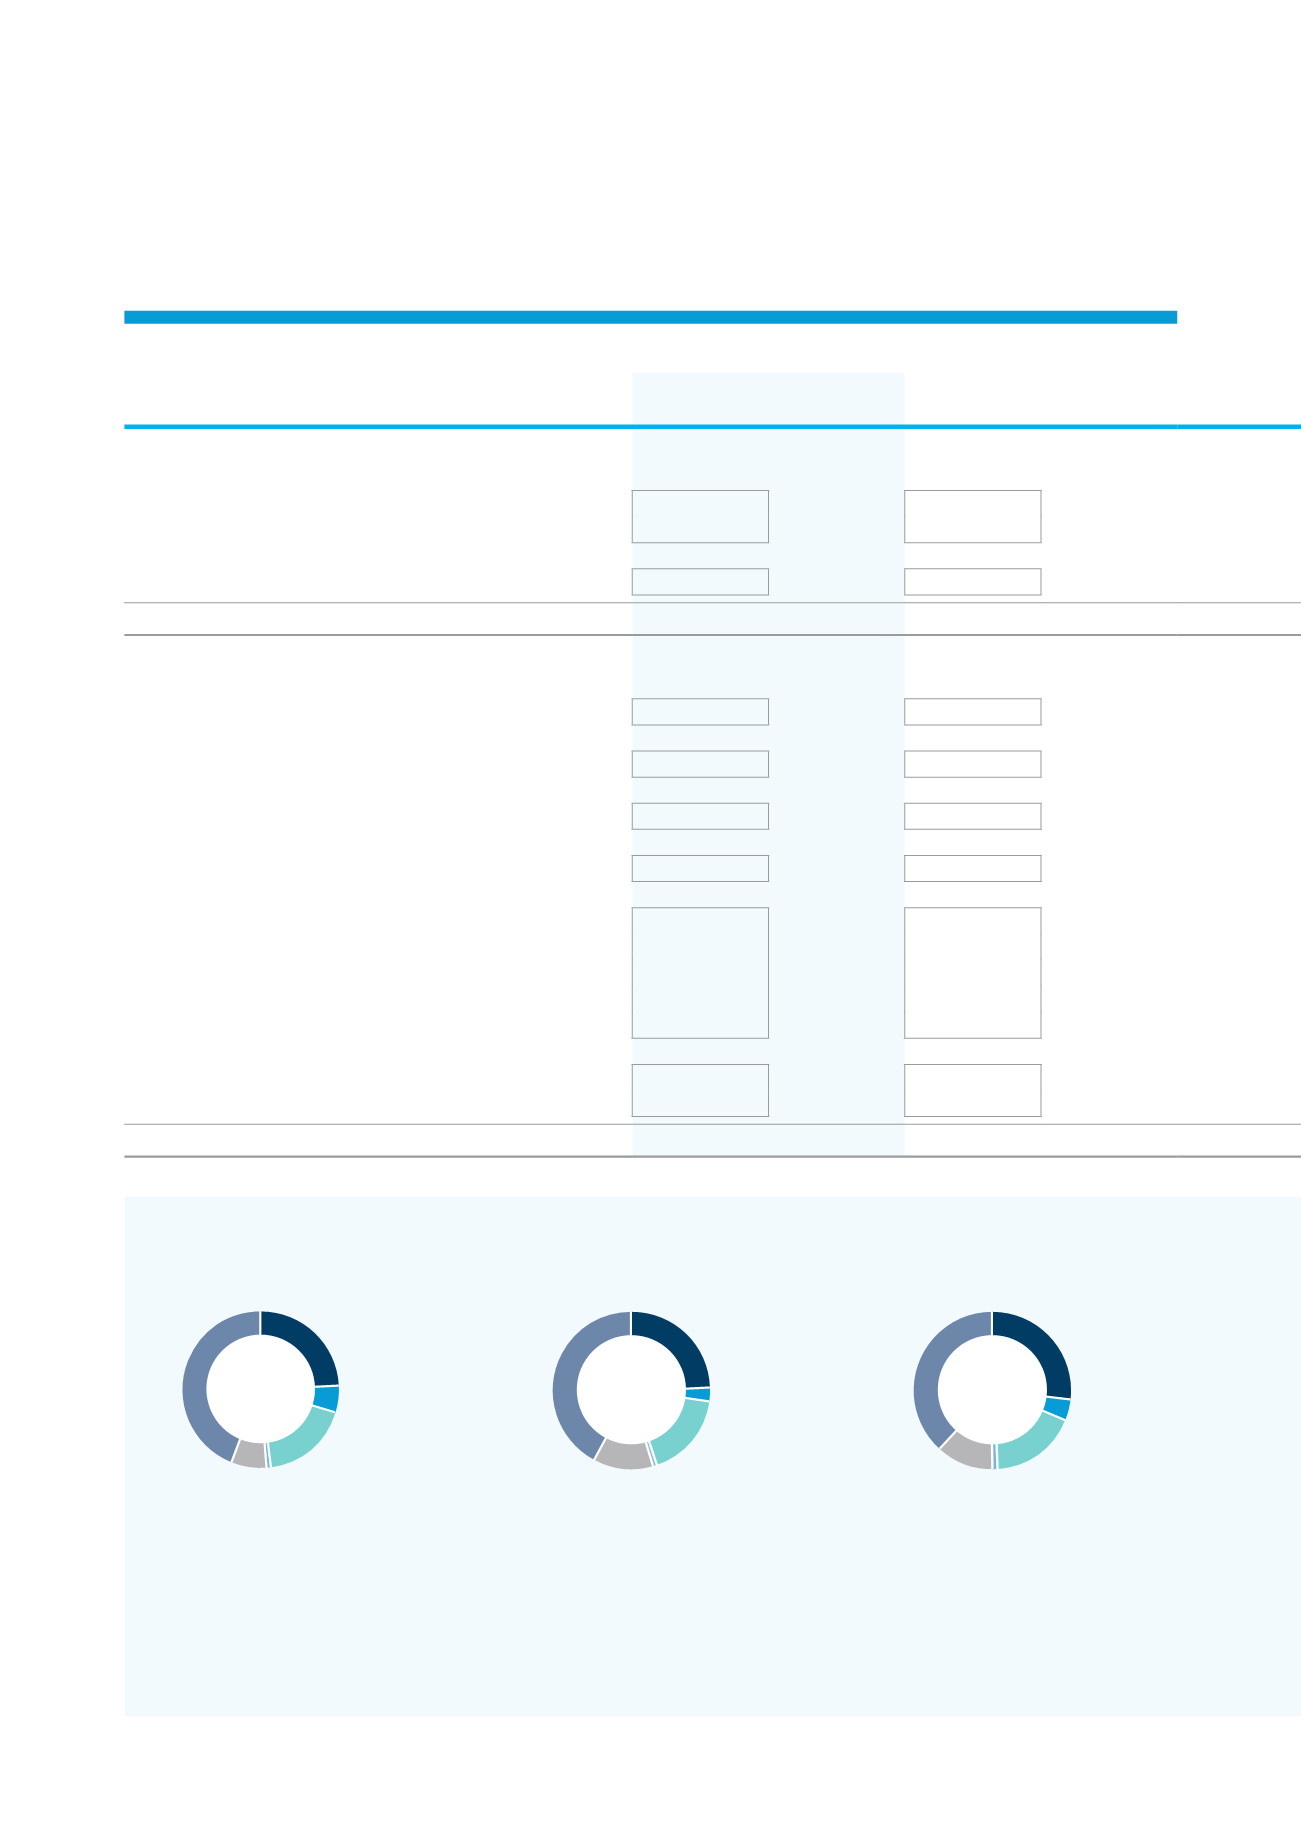
X
Employees
24.2%
X
Providers of finance
5.6%
X
The state
18.5%
X
Social responsiblitiy
0.5%
X
Reinvested
7.4%
X
Value retained
43.8%
Value distributed
2017
X
Employees
24.6%
X
Providers of finance
2.8%
X
The state
17.6%
X
Social responsiblitiy
0.4%
X
Reinvested
12.6%
X
Value retained
42.0%
Value distributed
2016
X
Employees
26.8%
X
Providers of finance
4.5%
X
The state
18.1%
X
Social responsiblitiy
0.4%
X
Reinvested
12.2%
X
Value retained
38.0%
Value distributed
2015