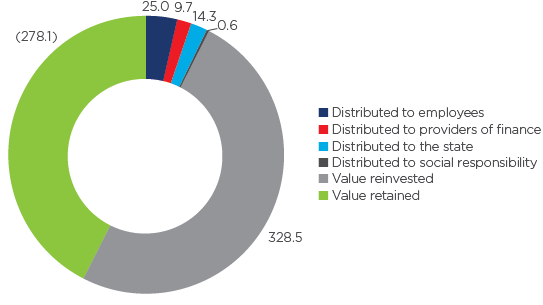
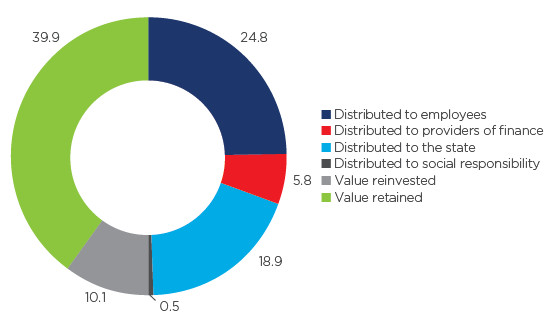
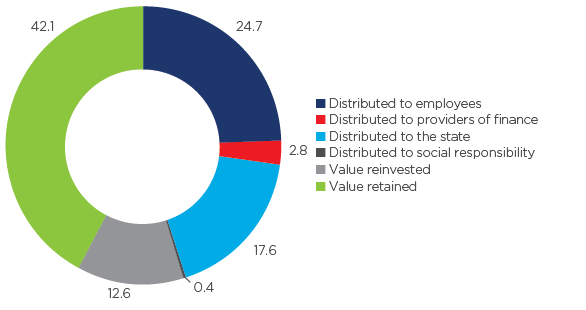
| |
|
Restated1
2018
R'000 |
|
2018
% |
2017
R'000 |
|
2017
% |
2016
R'000 |
|
2016
% |
| VALUE ADDED |
|
|
|
|
|
|
|
|
|
|
| Value added by operating activities |
|
1 945 220 |
|
91.0 |
1 749 186 |
|
95.7 |
1 674 203 |
|
96.3 |
| Revenue |
|
26 734 249 |
|
|
26 469 581 |
|
|
26 204 722 |
|
|
| Net operating expenses |
|
(24 789 029) |
|
|
(24 720 395) |
|
|
(24 530 519) |
|
|
| Value added by investing activities |
|
191 826 |
|
9.0 |
79 125 |
|
4.3 |
64 266 |
|
3.7 |
| Interest income |
|
191 826 |
|
|
79 125 |
|
|
64 266 |
|
|
|
|
|
|
|
|
|
|
|
|
|
| |
|
2 137 046 |
|
100 |
1 828 311 |
|
100 |
1 738 469 |
|
100 |
| VALUE DISTRIBUTED |
|
|
|
|
|
|
|
|
|
|
| Distributed to employees |
|
524 187 |
|
24.5 |
452 985 |
|
24.8 |
427 116 |
|
24.7 |
| Salaries, wages, medical and other benefits |
|
524 187 |
|
|
452 985 |
|
|
427 116 |
|
|
| Distributed to providers of finance |
|
166 613 |
|
7.8 |
105 518 |
|
5.8 |
48 207 |
|
2.8 |
| Finance costs |
|
166 613 |
|
|
105 518 |
|
|
48 207 |
|
|
| Distributed to the state |
|
330 920 |
|
15.5 |
345 990 |
|
18.9 |
305 420 |
|
17.6 |
| Income Tax |
|
330 920 |
|
|
345 990 |
|
|
305 420 |
|
|
| Distributed to social responsibility |
|
9 287 |
|
0.4 |
8 460 |
|
0.5 |
6 528 |
|
0.4 |
| Corporate social investment |
|
9 287 |
|
|
8 460 |
|
|
6 528 |
|
|
| Value reinvested |
|
(69 731) |
|
(3.3) |
185 000 |
|
10.1 |
219 586 |
|
12.6 |
| Depreciation, amortisation and impairment |
|
314 197 |
|
|
112 851 |
|
|
98 183 |
|
|
| Net discounting finance cost |
|
136 551 |
|
|
(1 210) |
|
|
(16 174) |
|
|
| Share of (profits)/losses of associates and joint ventures |
|
(520 628) |
|
|
89 533 |
|
|
71 770 |
|
|
| Deferred taxation |
|
149 |
|
|
(16 174) |
|
|
13 363 |
|
|
| Value retained |
|
1 175 770 |
|
55.0 |
730 358 |
|
39.9 |
731 612 |
|
42.1 |
| Retained profit |
|
1 122 085 |
|
|
696 462 |
|
|
691 590 |
|
|
| Minority shareholders' interest |
|
|
|
33 896 |
|
|
40 022 |
|
|
|
|
|
|
|
|
|
|
|
|
|
| |
|
2 137 046 |
|
100 |
1 828 311 |
|
100 |
1 738 469 |
|
100 |