


 31 / 220

BLUE LABEL
INTEGRATED ANNUAL REPORT 2017
29
/
Non-controlling interests
Non-controlling interests comprise a
minority share of profits in Cigicell,
Transaction Junction, Via Media and
Blue Label Data Solutions, the total
of which equated to R34 million.
Revenue remained consistent with
that of the prior year. However,
revenue generated on “PINless
top-ups” increased by R2 billion from
R4.1 billion to R6.1 billion, equating
to effective growth in South African
Distribution revenue of 7%, in that
only the commission earned thereon
is recognised.
Net commissions earned on the
distribution of prepaid electricity
continued to increase, escalating by
Of this amount, R6.9 million was
attributable to Cigicell, R12.1 million
to Via Media, R10.1 million to
Transaction Junction and R4.5 million
to Blue Label Data Solutions.
R18 million to R215 million on a value
of R14 billion generated on behalf of
the utilities.
Gross profit margins improved from
6.15% to 7.43%, resulting in an
increase in gross profit of R334 million
(21%) from R1.58 billion to
R1.92 billion. The improvement in
margins was attributable to a hybrid
of additional discounts received on
early settlement payments and
compounded annuity revenue. The
Core headline earnings
Core headline earnings increased by
R116 million (17%) to R801 million.
This equated to core headline earnings
per share of 120.09 cents.
increase in gross profit was partially
negated by additional net finance
costs, congruent with applying excess
funds and facilities on a piecemeal
basis to early settlement discounts.
EBITDA increased by 22% to
R1.39 billion equating to an EBITDA
margin of 5.38%.
Contribution to Group core headline
earnings increased by R142 million
(19%) to R893 million.
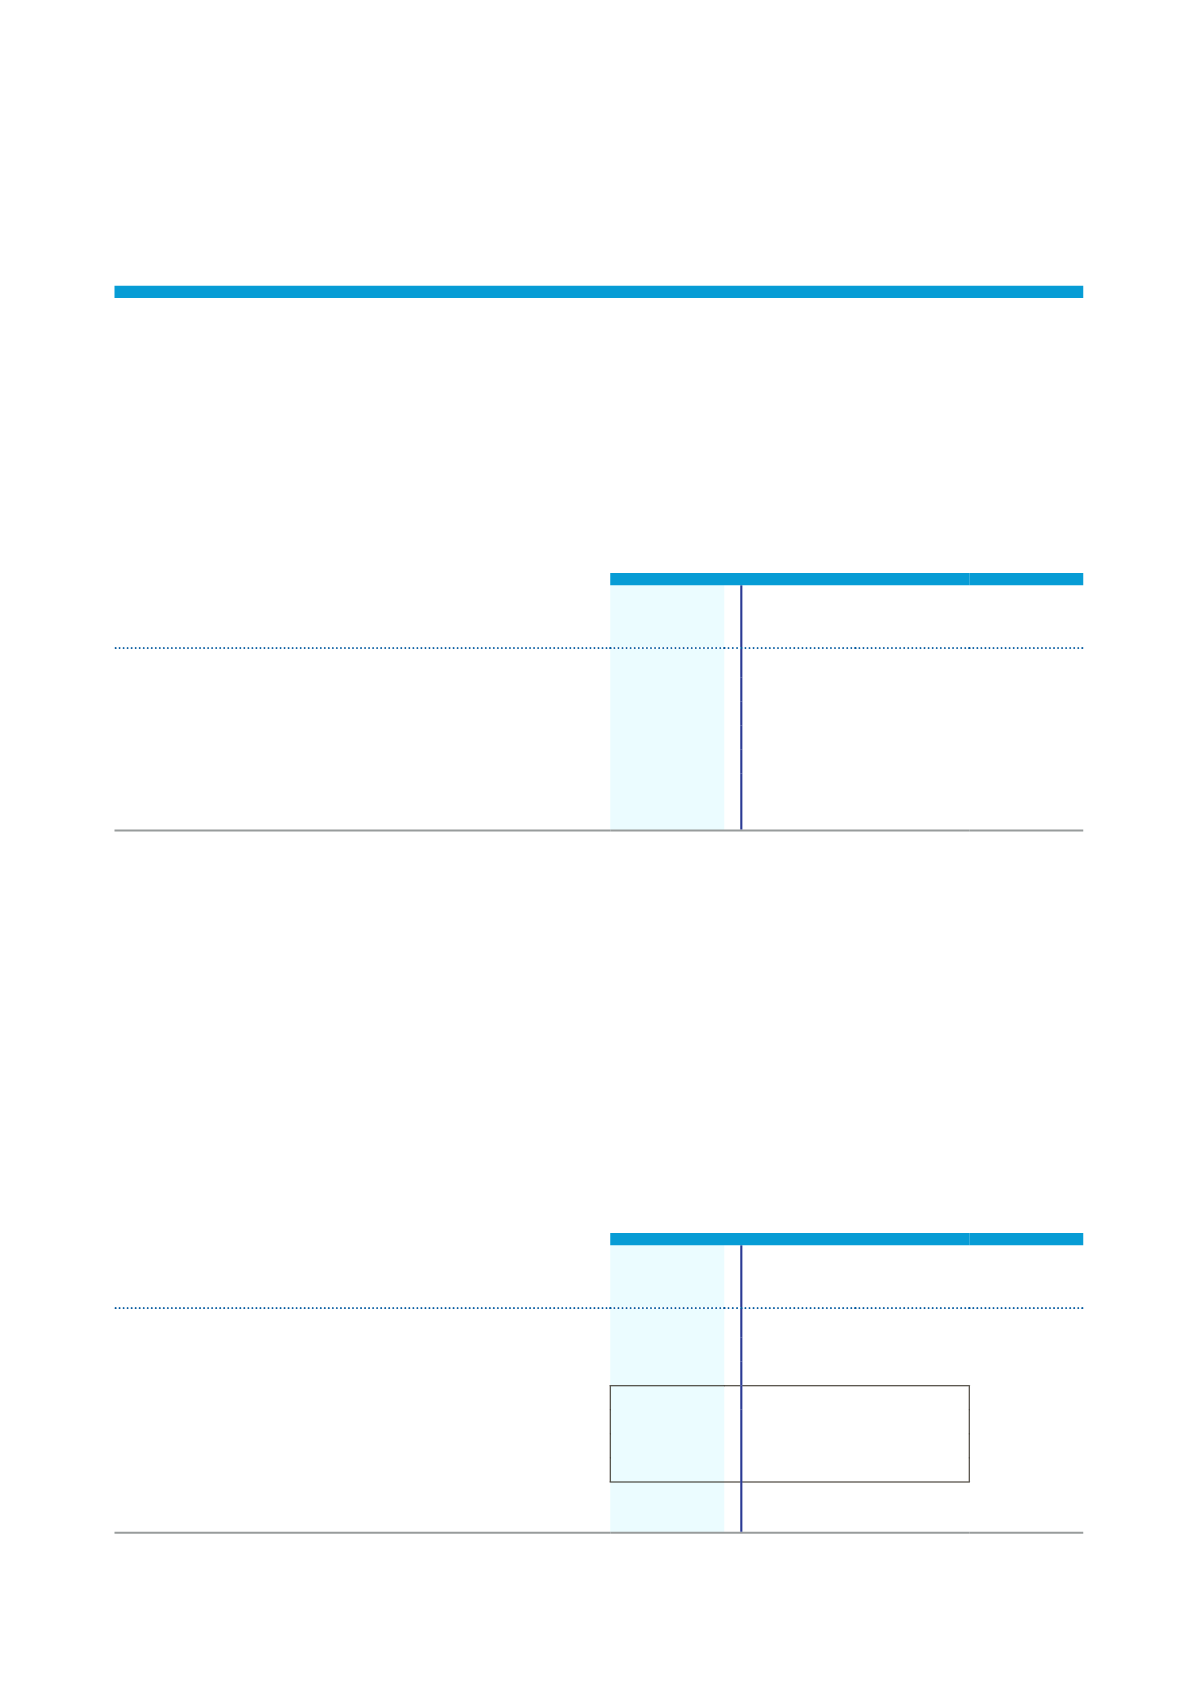
Segmental report
South African Distribution
May 2017
R’000
May 2016
R’000
Growth
R’000
Growth
%
Revenue
25 786 396
25 722 540
63 856
0%
Gross profit
1 917 023
1 582 743 334 280
21%
EBITDA
1 388 296
1 133 433 254 863
22%
Core net profit
893 106
750 951 142 155
19%
Core headline earnings
893 128
751 086 142 042
19%
Gross profit margin
7.43%
6.15%
EBITDA margin
5.38%
4.41%
International Distribution
May 2017
R’000
May 2016
R’000
Growth
R’000
Growth
%
EBITDA
(31 792)
44 152
(75 944)
(172%)
Gain on associate measured at fair value
160 200
— 160 200
Share of (losses)/profits from associates and joint ventures
(162 218)
(70 283)
(91 935)
(131%)
– Oxigen Services India
(119 831)
(27 672)
(92 159)
(333%)
– Blue Label Mexico
(36 978)
(63 293)
26 315
42%
– 2DFine Holdings Mauritius
(5 409)
19 734
(25 143)
(127%)
– Mpower
—
948
(948)
(100%)
Core net loss
(17 213)
(29 352)
12 139
41%
Core headline loss
(16 874)
(59 327)
42 453
72%