


 12 / 220

BLUE LABEL
INTEGRATED ANNUAL REPORT 2017
/
10
Ten-year review
2017
R’000
2016
R’000
2015
R’000
Revenue
26 311 875
26 204 722
22 044 222
Gross profit
2 172 582
1 829 694
1 644 340
GP (%)
8.26
6.98
7.46
EBIT
1 218 472
1 142 376
986 146
EBITDA
1 331 323
1 240 559
1 080 165
Net profit attributable to the parent
786 965
691 590
577 617
Cash from operating activities
1 361 959
432 942
132 495
Cash and cash equivalents
1 350 666
589 027
788 411
Capital expenditure
113 280
127 131
178 684
Ratios
EPS (cents)
117.92
103.85
86.86
HEPS (cents)
117.98
100.35
82.26
Core HEPS (cents)
120.09
102.85
85.11
NAV per share (cents)
731.98
662.32
578.87
Dividends declared per share (cents)
40*
36*
31*
Dividend cover on headline earnings (cents)
2.25*
2.75*
2.62*
Weighted average number of shares (’000)
667 349
665 950
665 030
Number of employees at year-end – subsidiaries
796
776
1 305
* Gross ordinary dividend.
** Figures relate to the pro forma unaudited information.
*** Includes a once-off income receipt of R79.4 million.
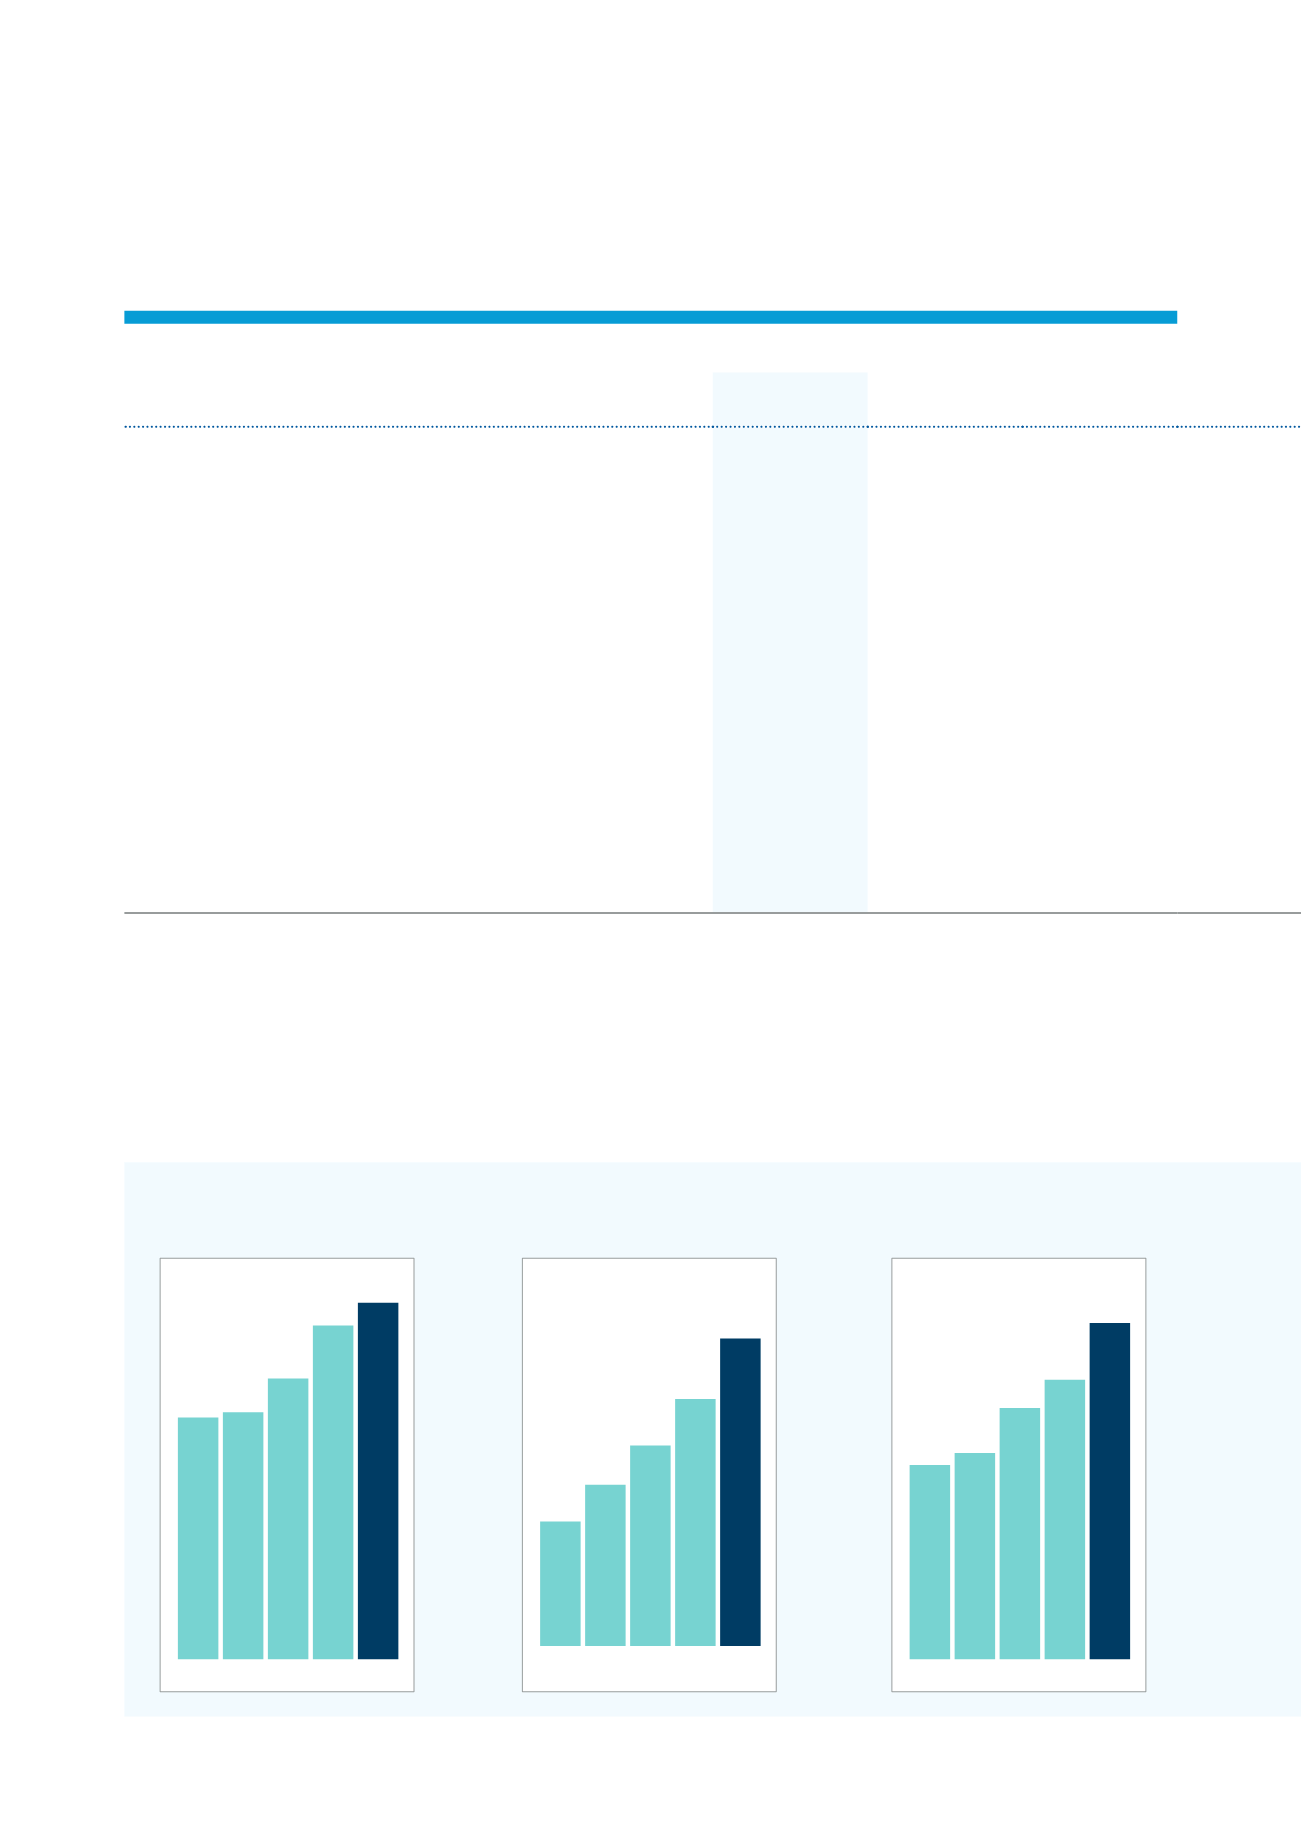
Revenue
(R’million)
2017
2016
2015
2014
2013
26 312
18 984
19 402
22 044
26 205
Gross PINless transactional
values*
(R’million)
20 131
8 159
10 557
13 123
16 179
*Includes gross electricity and PINless top-ups.
2017
2016
2015
2014
2013
Gross profit
(R’million)
2 173
1 271
1 350
1 644
1 830
2017
2016
2015
2014
2013