


 104 / 220

/
102
BLUE LABEL
INTEGRATED ANNUAL REPORT 2017
Notes
to the Group annual financial statements
continued
For the year ended 31 May 2017
1.
Results of operations
1.1 Segmental summary
The Group’s segment reporting follows the organisational structure as reflected in its internal management reporting
systems, which are the basis for assessing the financial performance of the business segments and for allocating
resources to these segments. Management’s assessment of the Group’s organisational structure takes the
geographical location of the segments into account.
Operating segments are reported internally to the chief operating decision-maker in a manner consistent with the financial
statements. In addition, the chief operating decision-maker uses core net profit and core headline earnings as non-IFRS
measures in evaluating the Group’s performance on a segmental level. The chief operating decision-maker, who is responsible
for allocating resources and assessing performance of the operating segments, has been identified as the executive directors,
who are responsible for making strategic decisions on behalf of the Group.
Transactions between reportable segments are conducted on similar terms as other transactions of a similar nature.
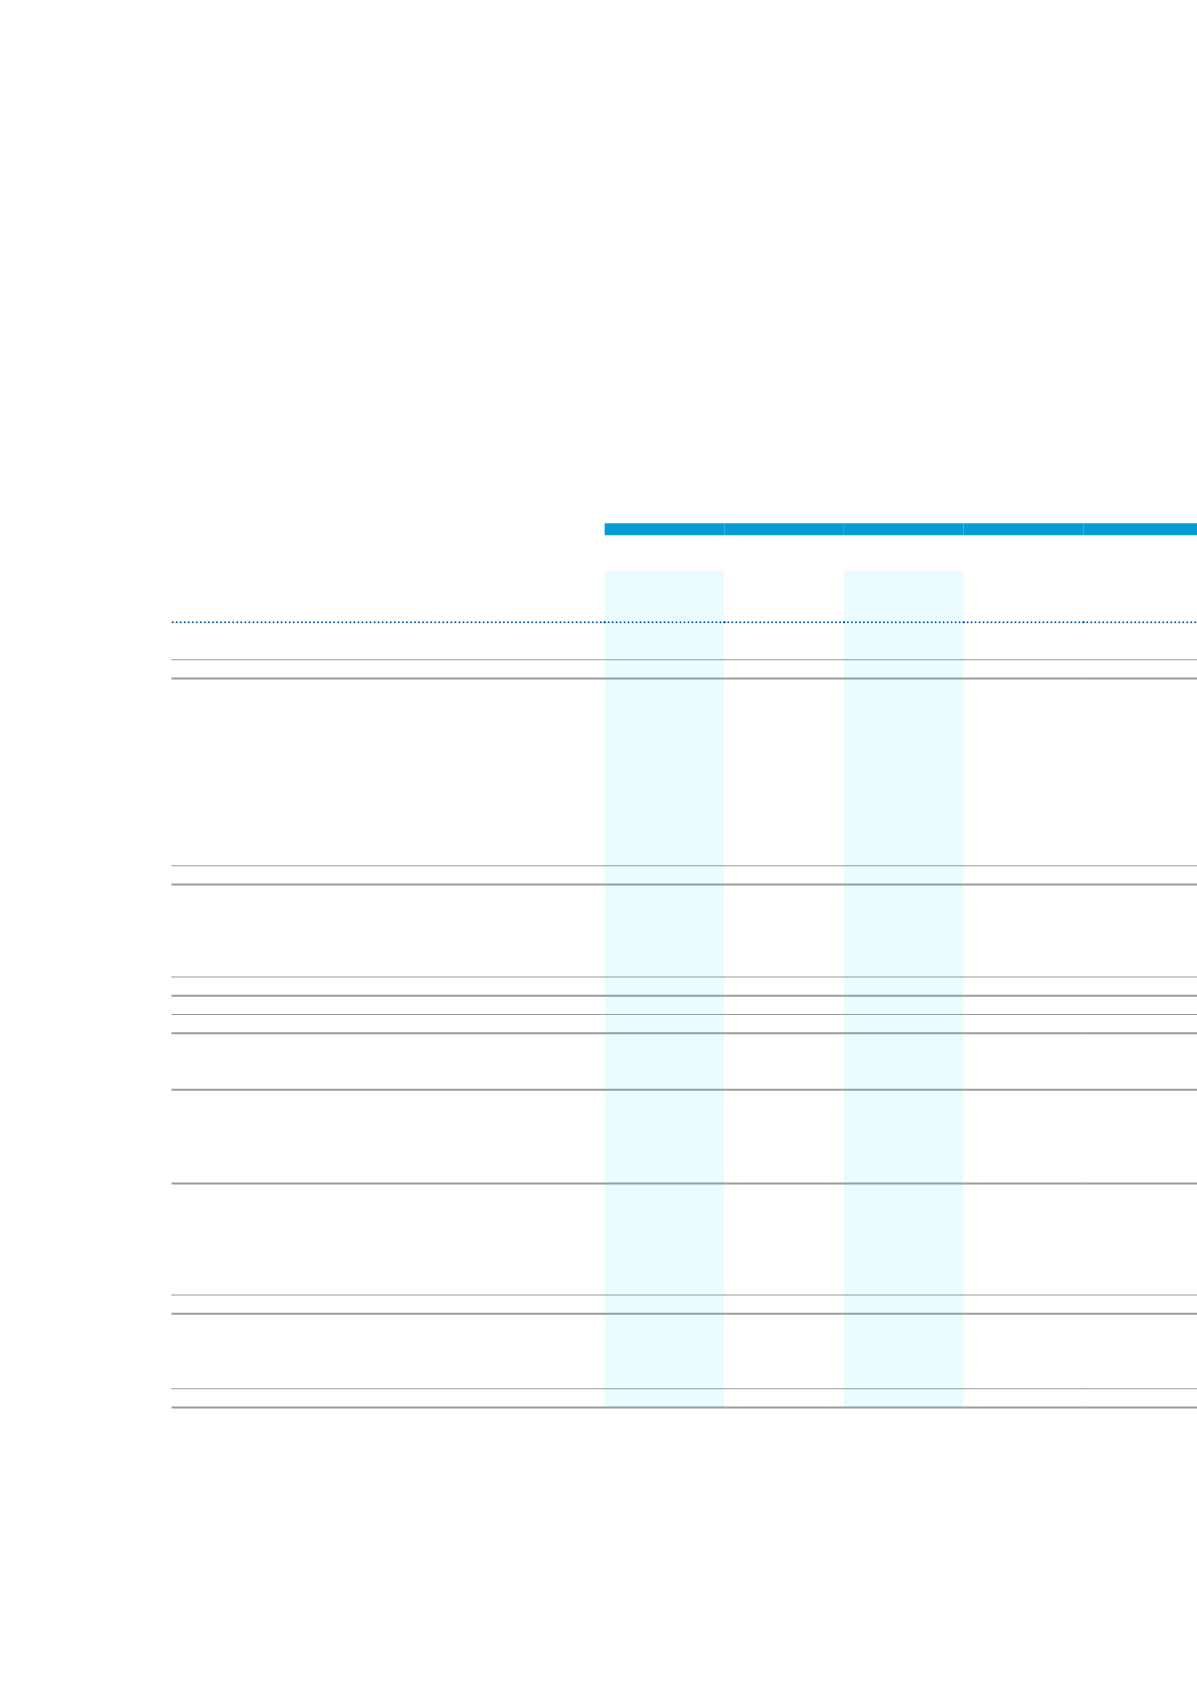
The segment results for the year ended 31 May are as follows:
Total
South Africa Distribution
2017
R’000
2016
R’000
2017
R’000
2016
R’000
Total segment revenue
32 724 069
32 558 421
32 058 672
31 934 736
Internal revenue
(6 412 194)
(6 353 699)
(6 272 276)
(6 212 196)
Revenue
26 311 875
26 204 722
25 786 396
25 722 540
Segment result
Operating profit/(loss) before depreciation, amortisation and
impairment charges
1 331 323
1 240 559
1 388 296
1 133 433
Depreciation, amortisation and impairment charges
(112 851)
(95 615)
(92 554)
(74 562)
Impairment of intangible assets
—
(2 568)
—
(1 042)
Finance costs
(303 027)
(214 110)
(297 889)
(203 713)
Finance income
242 194
193 899
211 386
169 198
Gain on associate and joint venture measured at fair value
160 200
—
—
—
Share of (losses)/profits from associates and joint ventures
(164 941)
(71 770)
(5 406)
(4 937)
Taxation
(332 037)
(318 783)
(303 040)
(258 313)
Net profit/(loss) for the year
820 861
731 612
900 793
760 064
Reconciliation of net profit for the year to core headline
earnings for the year
Net profit/(loss) for the year
820 861
731 612
900 793
760 064
Amortisation of intangibles raised through business
combinations net of tax
14 833
17 457
9 775
11 617
Core net profit/(loss) for the year*
835 694
749 069
910 568
771 681
Headline earnings adjustment
362
(23 029)
22
435
Core headline earnings for the year*
836 056
726 040
910 590
772 116
Core headline earnings for the year attributable to:
Equity holders of parent
801 396
684 911
893 128
751 086
Non-controlling interest
34 660
41 129
17 462
21 030
Non-cash items
Net (loss)/profit on sale of subsidiaries
—
(3 885)
—
—
Net profit on disposal of associates
—
—
—
—
Discounting of receivables
163 069
129 633
163 069
129 633
Discounting of payables
(197 509)
(165 903)
(197 509)
(165 903)
The segment assets and liabilities at 31 May are as follows:
Assets excluding investments in and loans to associates and
joint ventures
7 830 272
6 395 384
7 113 582
5 725 082
Investments in and loans to associates and joint ventures
315 833
910 567
87 945
62 649
Investments in and loans to venture capital associates and
joint venture
544 165
—
—
—
Total assets
8 690 270
7 305 951
7 201 527
5 787 731
Additions to non-current assets
Property, plant and equipment
57 655
41 956
51 074
37 706
Intangible assets and goodwill
57 137
85 175
52 138
53 562
Investment in associates
21 306
210 416
21 306
—
Total liabilities
(3 685 828)
(2 786 387)
(3 446 376)
(2 482 650)
The Company is domiciled in the Republic of South Africa. The result of its revenue from external customers in South
Africa is R26.294 billion (2016: R26.188 billion), and the total revenue from external customers from other countries
is R17.7 million (2016: R16.9 million).
The total non-current assets other than financial instruments and deferred tax assets located in South Africa is
R1.372 billion (2016: R1.426 billion), and the total non-current assets located in other countries is R721 million
(2016: R792 million).
The South African Distribution segment includes revenues of R7.737 billion and R4.901 billion earned from two
external customers.